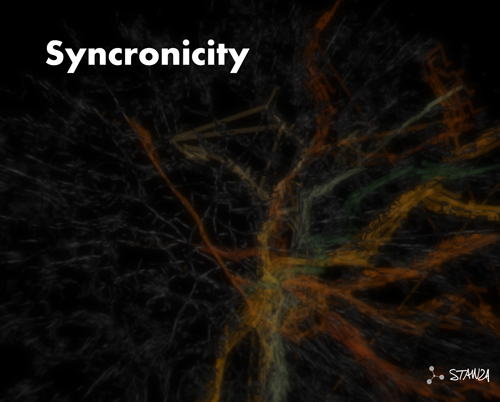
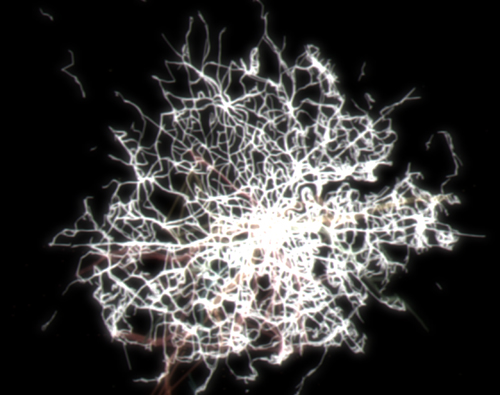
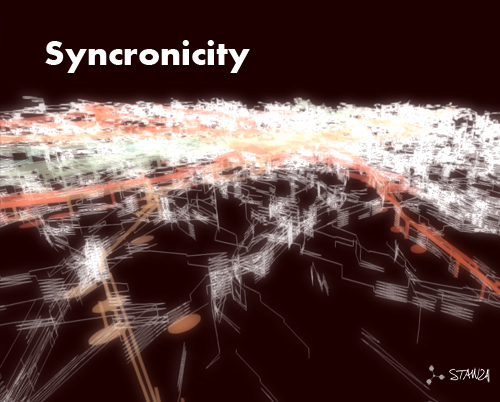
"Syncronicity: Layers of Infinite Possibilities In A World Of Closing Borders." 2013 The artwork to visualises the agency of real city as a morphing growing system. Synchronicity, choreographs real time transport data of London to re-interpret the city fabric as an organic pattern based system. The artwork uses real time bus and tube data from London accessed from several online networked sources. The map forms itself because of the changes data over time of the buses and tubes post ions ie its formed by these movements through the city. Synchronicity becomes a hybridized maze, a cellular and organic system which is presented to the screen. An artwork about mapping, data as culture, and how information bombards us everywhere.
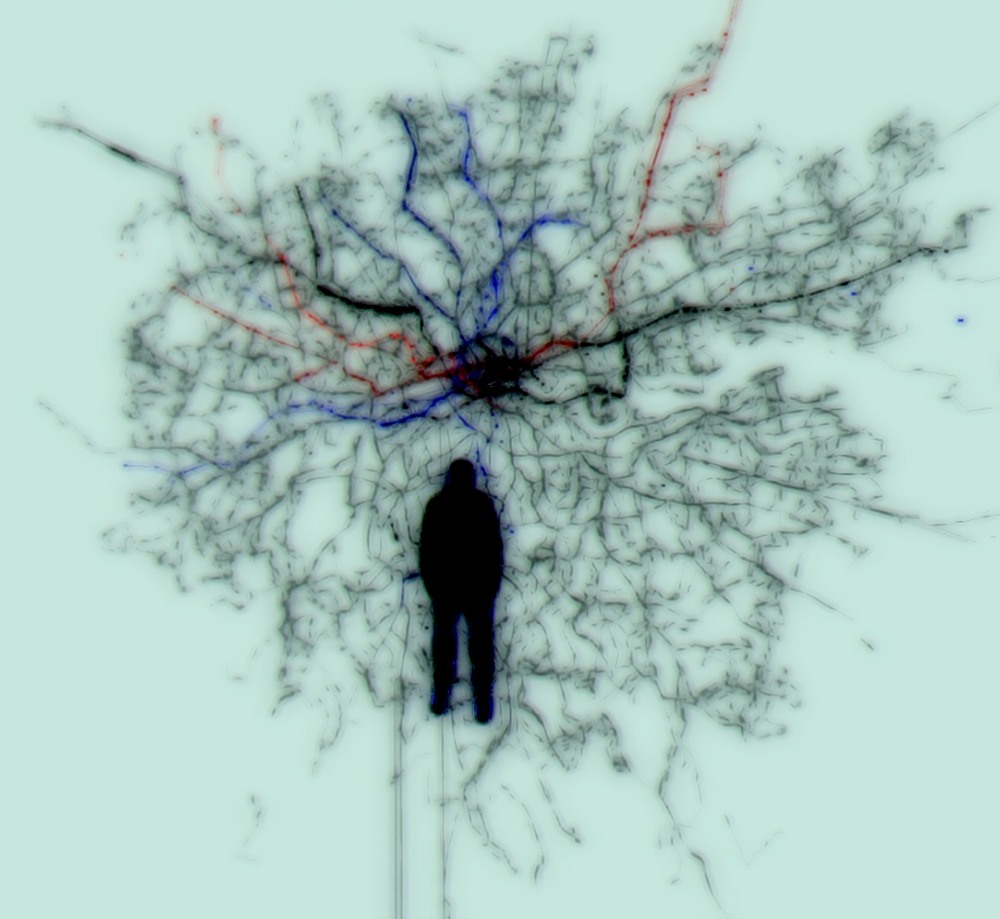
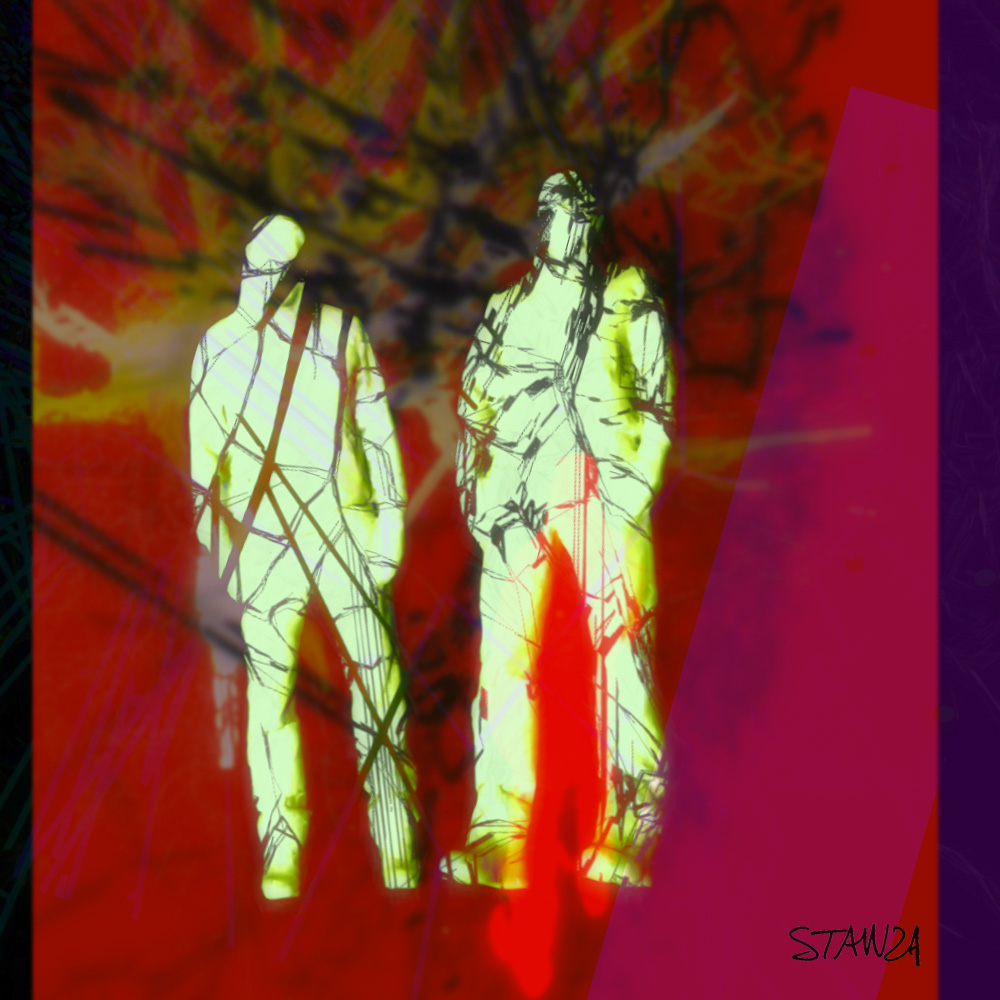
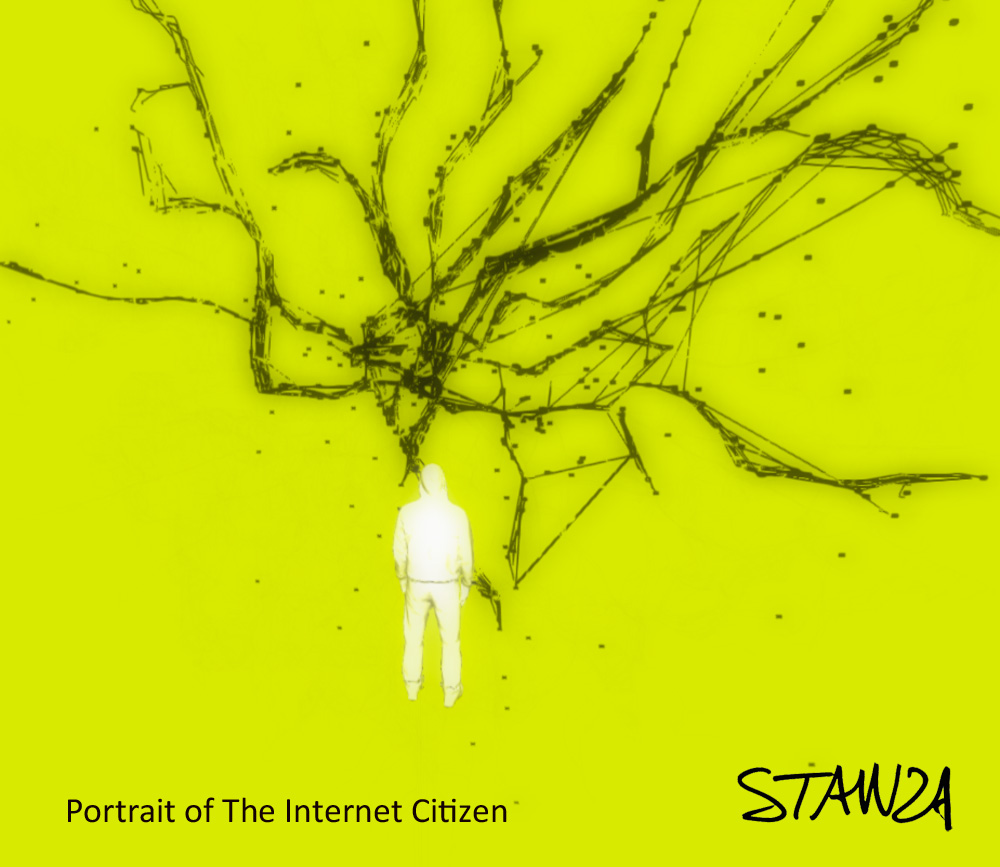
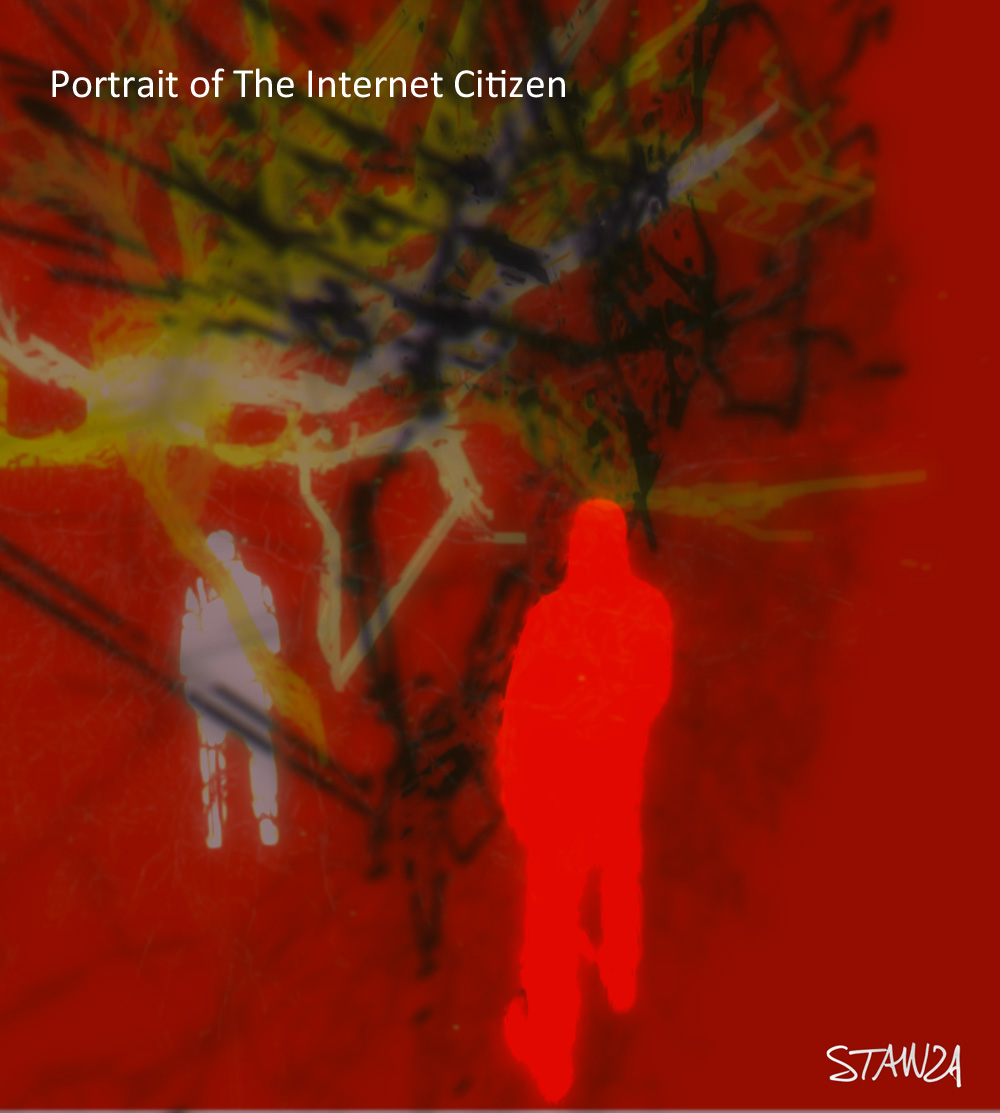
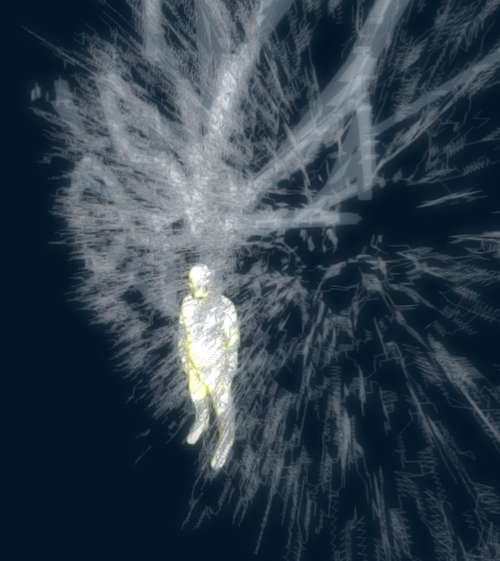
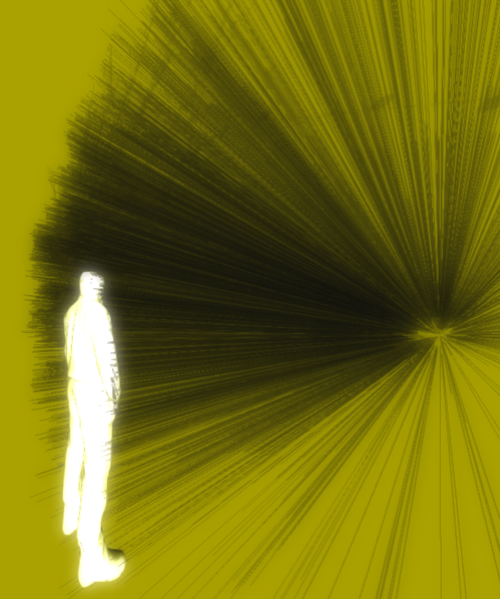
Version II with the body "Databody Portrait Of The Internet Citizen" see below for screen shots The version embeds a human body inside the system as the data flows all around in a slipstream of information. Concepts
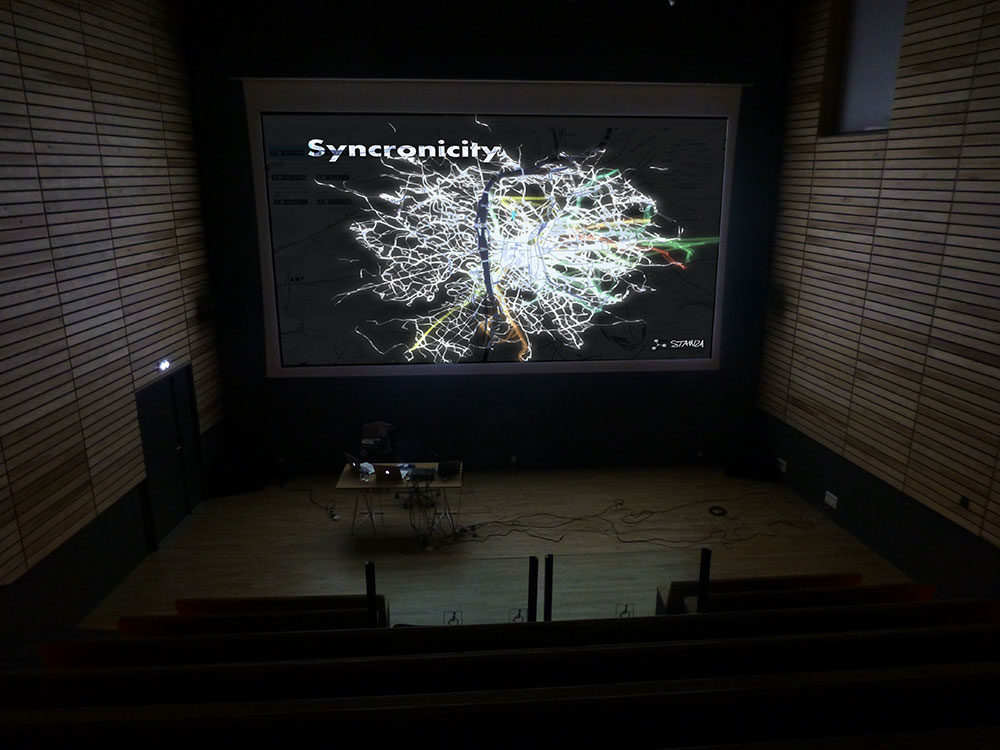
In The Gallery (Overview) A software interface allows manipulation of the parameters and the results of the system. The Syncronicity map builds up in 3d over time and one can change colours to highlight different abstractions based on the data. Technical There is an interface for drawing different graphical effects such as moving the paths into 3D space based on their timestamp's, exploding the 3D element with a slider, changing the FOV of 3D camera, changing the width of lines, changing the alpha blending value of lines. You can also rotate around the whole map and if you blend it right, you can see that there are way more paths in the centre of the map than the outskirts. Also, if you set the FOV right, you will get the paths on the outskirts blurring and the ones in the centre in focus, as the camera is pointing here. In drawing all the tube lines, each train is matched to one of the train lines, and drawn with a colour from that document . Speed of tube trains are discovered from their estimated time to the next stop, and their movement is animated using little circles for every train. 500-600 or so tube trains are used during the day and about 60 at night and over a thousand buses are used in this integrated tube and bus map. GPU camera effects produce some stunning looking lines with depth of field, blurring things out of focus. Everything anti-aliased without too much effect on performance. Synchronicity is made using open frameworks. It needs a good Apple MAC and internet connection. Available. This work is available for exhibition. Commissioned by Waterman's Arts Centre London. Thanks to Irini Papadimitriou. Exhibitions: Waterman's Art Centre. London. Nov 2014 Keywords, data visualisation, real time buses, art, software, net art,
Part of Live Performance at LA Panacee France.
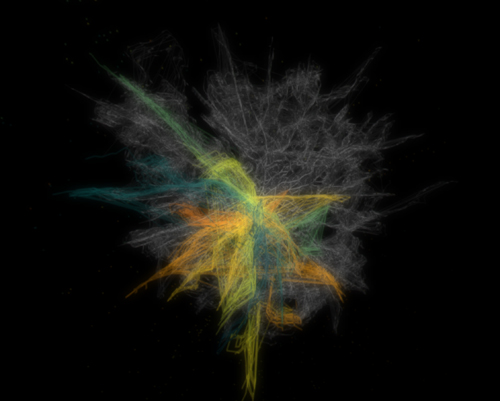
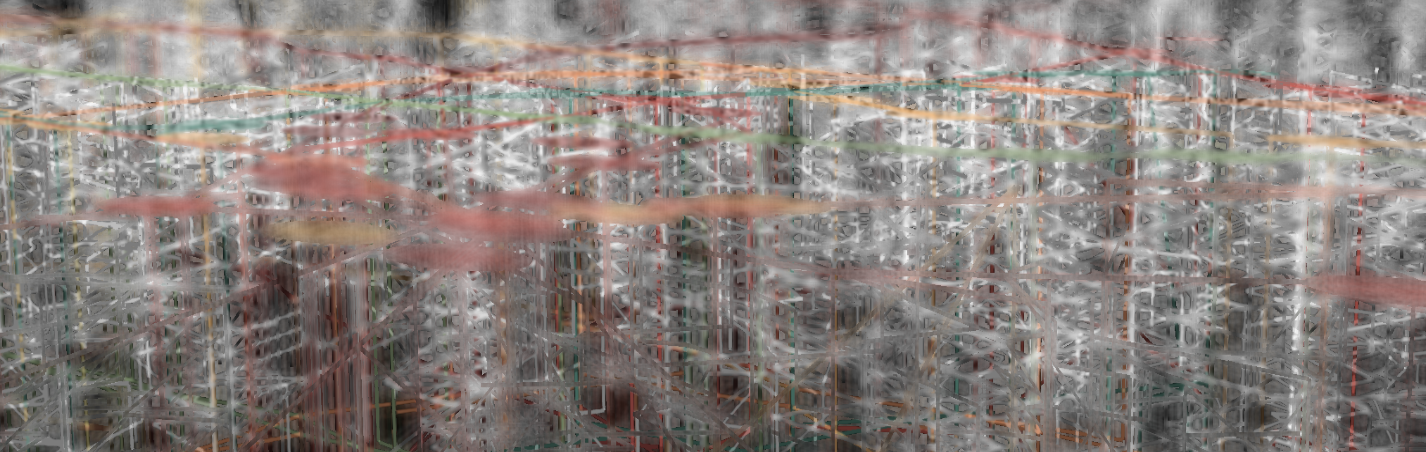
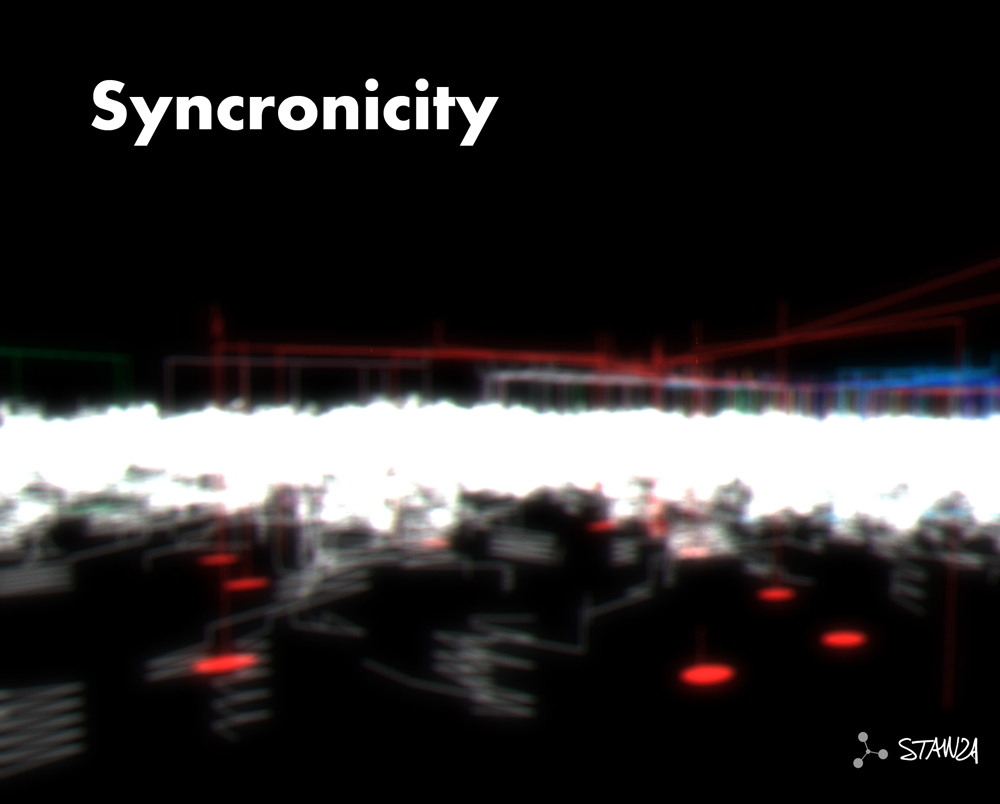
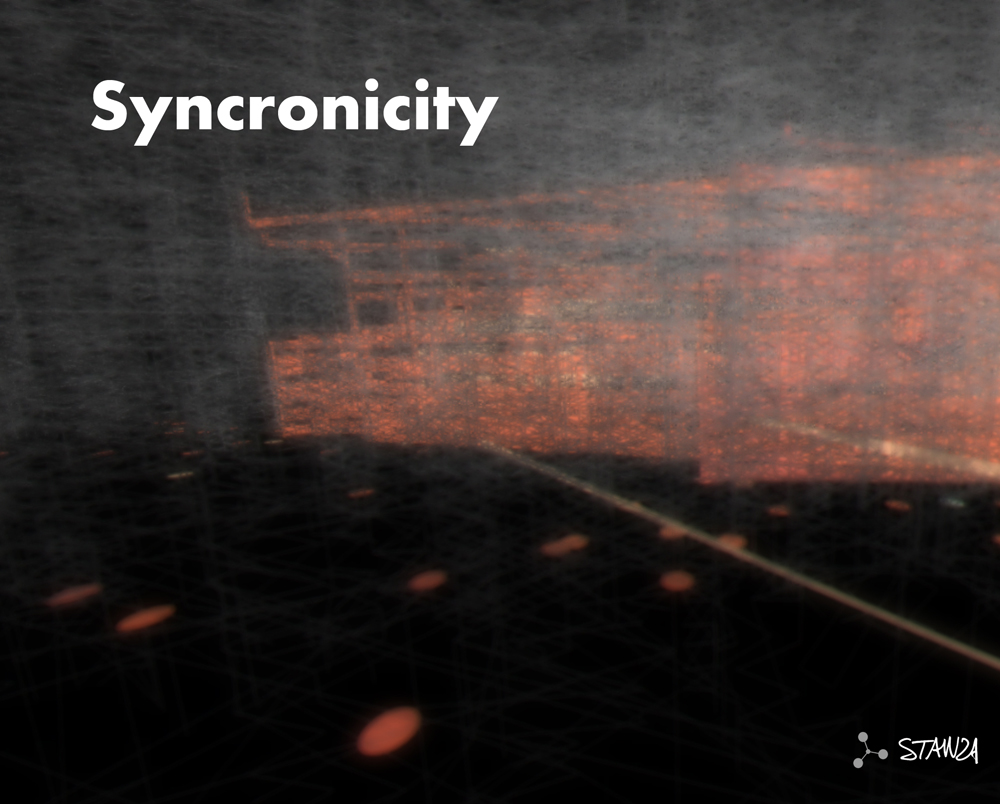
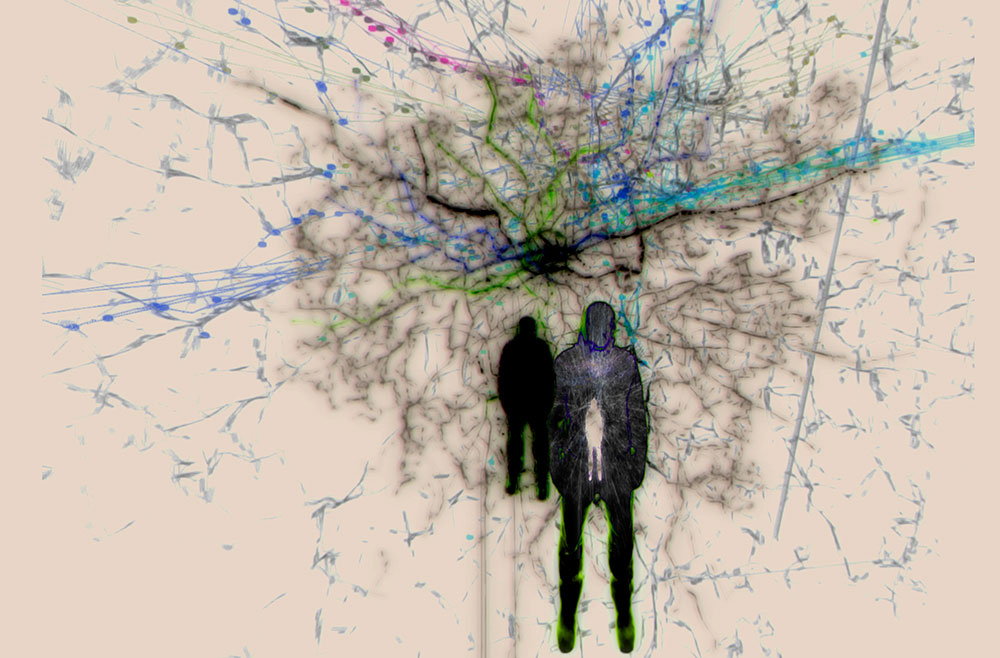
Layers of data over time. (extruded)
Layers of data over time screenshots
Keywords: Net art, data art, generative, software, networked, interactive, software, artwork www.stanza.co.uk An artwork by Stanza. f = full screen g = gui interface Databody Portrait Of The Internet Citizen. Another extended version of the software. Screenshot below present the body inside the real time data flow of live tube and bus positions.
Real time data artwork using live bus and tube feeds from London
|
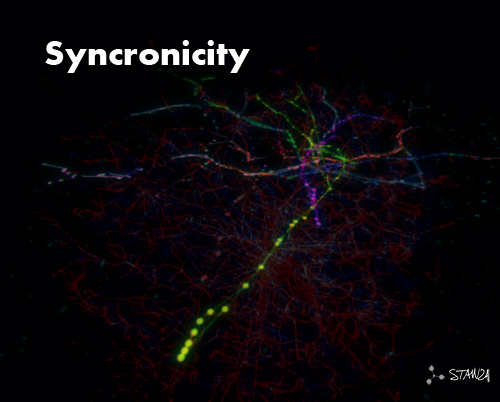
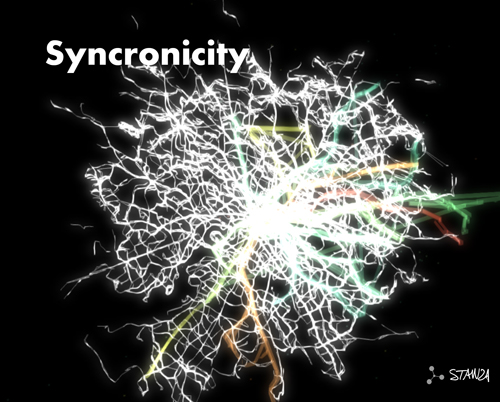
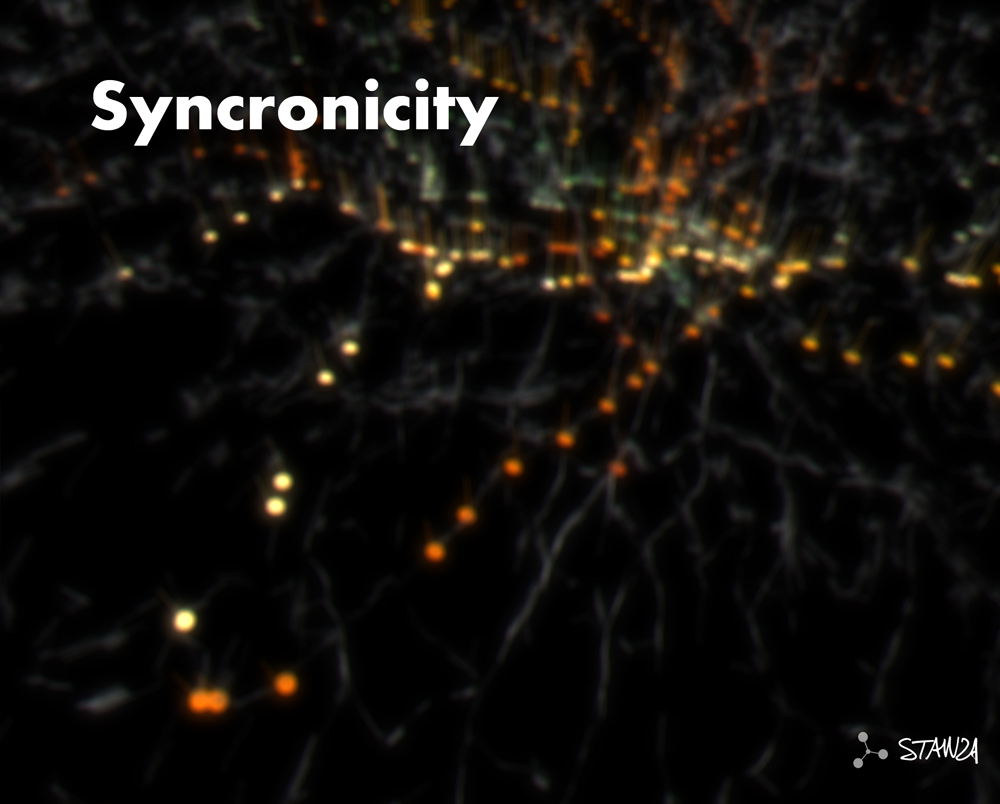
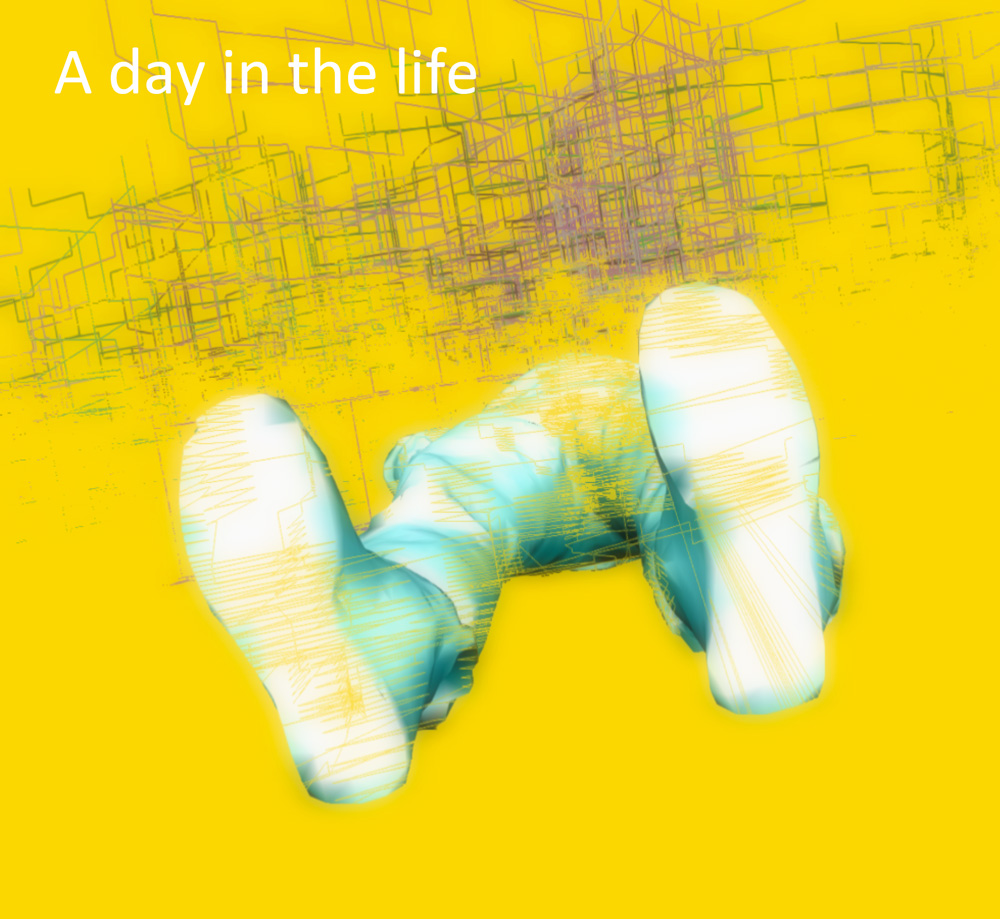
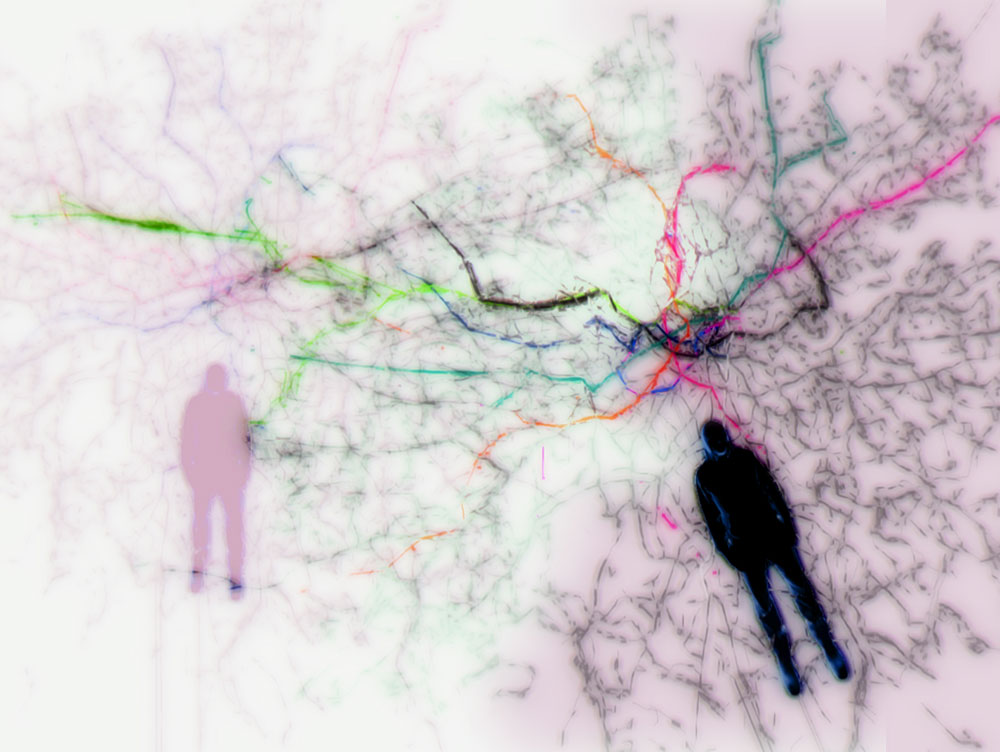
 Real time data artwork using live bus and tube feeds from London