| About | Graffiti | Manifesto | Choir | Exhibition | Branches | Derive | Activisims | Downloads | News | Contact |
 The Global Dérive: The Sum Is Greater Than The Parts
This is a piece of software that allows anyone participating to be tracked and visualised and become part of the artwork. Volunteers can be anywhere from 10 to 1000 or more people can can part of the artwork at once. The Global Derive, is a newly created artistic artwork engaging with issues of data ownership, privacy of information within the real time city.
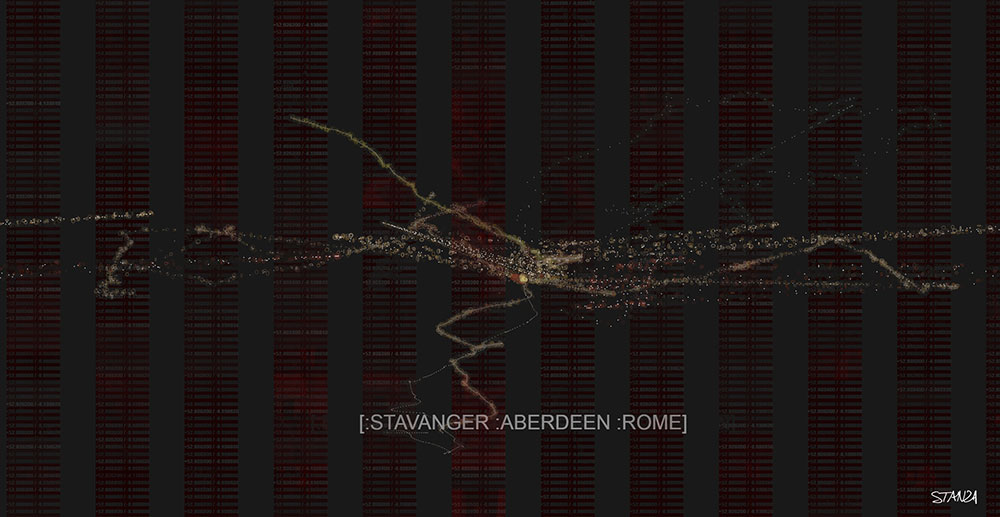
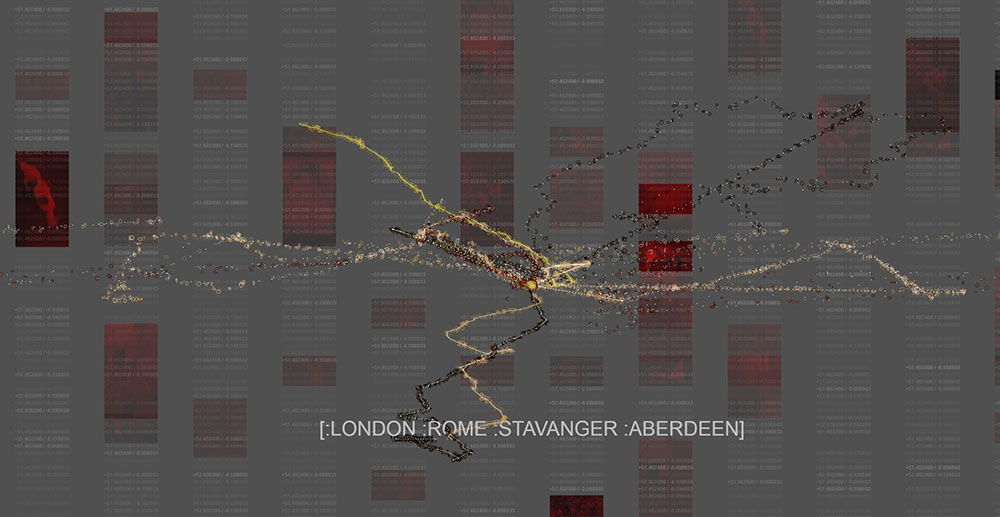
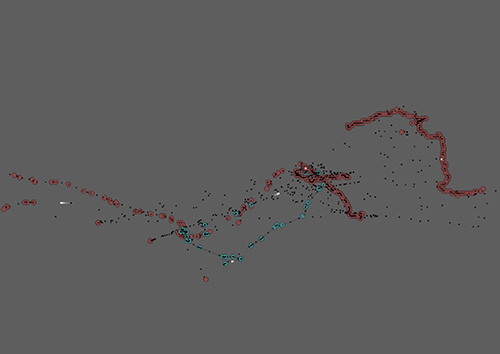
The system becomes a Performance Spectacle. People walk around the city. They are tracked and monitored created the data for the system. Custom made software tracks their real time position and the data is collected and fed back to the servers. This performance is exhibited on screens inside the gallery or outside in the city in real time. What you seen on the screen is a poetic interpretation, an abstracted interpretation.
Although they meander they are re-formed via software into active agents while their every move is monitored. The group of seemingly aimless individuals are actually collaborating to make the artwork which is visualised. The output represents the collective agency of the performing groups, thus the sum is greater than the parts. Each person in the system is by default an active participant in the creation of the result whether they like it or not. They the audience act as units of data, reduced and simplified and represented as a zero or a one.
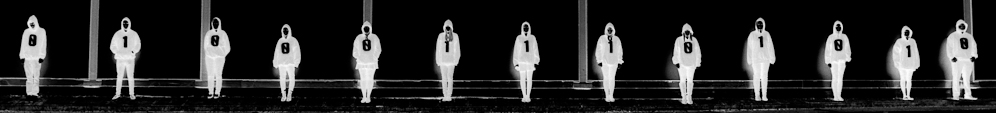
Often during this performative event volunteers wear hoodies and become the "The Binary Graffiti Club" as a group happening and these can be tracked in the city. They are monitored and surveyed and the collected data is used to visualise them on large screens in the city or gallery
Festival and large Groups.
This software is ideal for festivals as all your visitors can become involved in a massive collective artwork. They all become interactive participants of this digital artwork.

Context
There are 7 billion people on the planet which can be harvested as data assets. This artwork aims to unit everyone as collaborative agents for change. The artwork questions who owns the data we generate and suggests that privacy as a social concept is now obsolete.
The collective agency of the group is harvested and a virtual representation of a large population as a collective entity is made. The patterns we make, the visual and imaginative interpretations we give to real world events, are a networked into retrievable data structures that are re imagined and sourced. These data patterns disclose new ways of seeing the world. The individual is no longer present in the city. The city is now a fully integrated platform of observations owned and controlled by a bigger system. In this artwork every action forms part of the structure of the design of the city buffeted by its physical architecture and a newly created virtual city of data is formed.
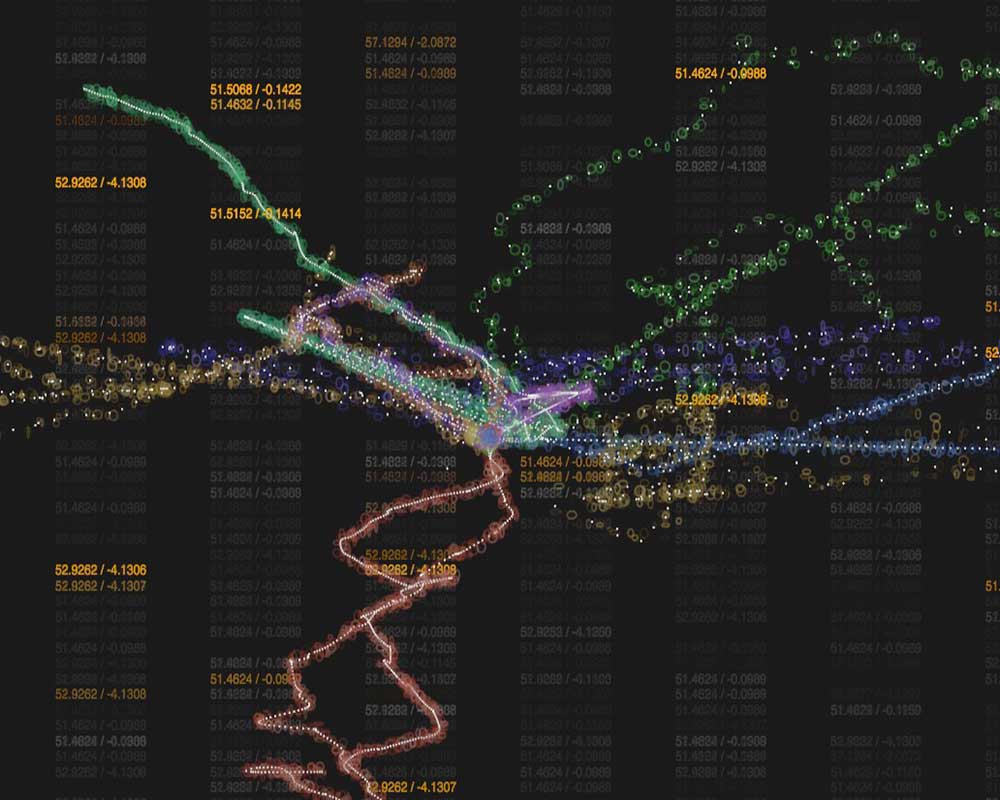
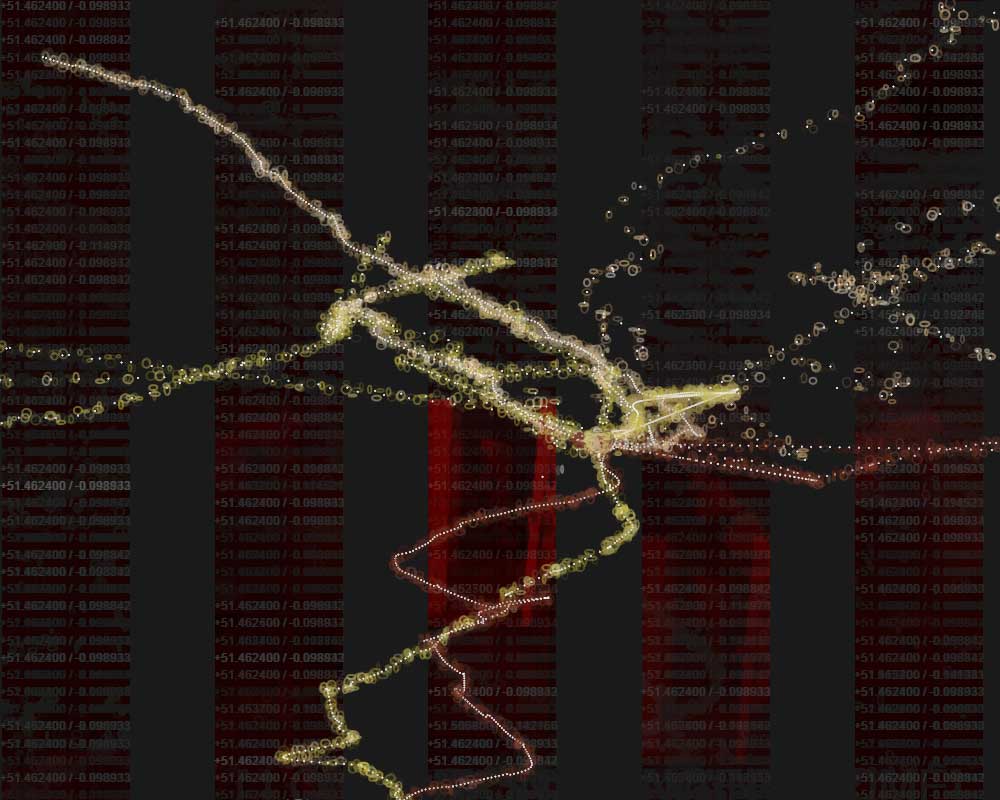
A newly developed software APP is used to collect the data and GPS locations. A server API formats the data in to JSON which is visualized into an interface written in Three JS and available back online. Everyone becomes part of a system watching everyone else.
Experience
The result is realized as a visualization and seen by the public on large screens in real time. The GPS positions and images are fused into an abstracted visual experience. Historical data from the other walks and cities is also fused into the artwork.
Online visualisation. (chrome browser is best) You need a graphic card installed and 16GB ram for it to run at decent frame rate. Ask me for details.
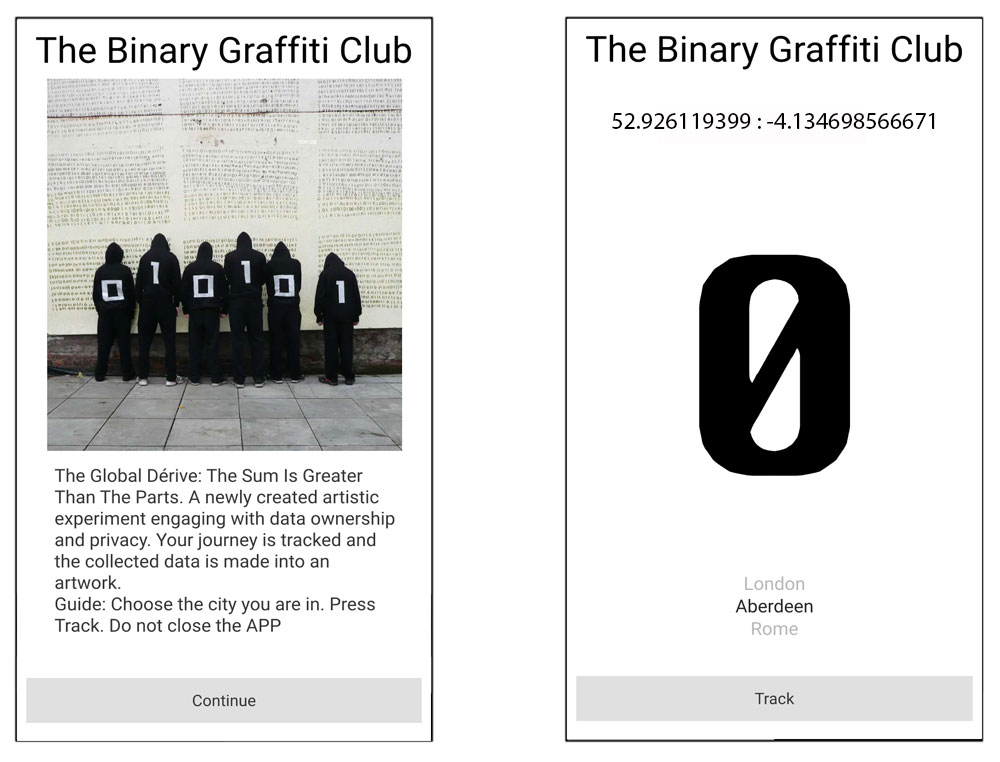
APP. A custom made app has been made and needs to be installed. See screen shots below. The tracking data phone app created for the project. V1 Android only.
Data. All the data once collected it becomes part of the an open virtual space that shares the value amongst its contributors. NOTE In line with the data protection act and our own ethical code of conduct all data is anonymised and represented in a way that allows the project to infer common ownerships of the material while allowing us to express the idea (We are however not hacking the data, not selling the data, and not disclosing any sensitive information.)
Ongoing
This software is ideal for festivals as all your visitors can become involved in a massive artwork. They all become interactive participants of the project. Funding is needed to develop this to the next level ie more features, interface for phone app , online interface visualisation and cross platform development. Now it is tested and working this can be scaled up. Contact me to book this.
Wider Cultural Context
The terms of flânerie dates to the 16th or 17th century, denoting strolling, idling, often with the connotation of wasting time. While Baudelaire characterized the flâneur as a "gentleman stroller of city streets. He saw the flâneur as having a key role in understanding, participating in, and portraying the city. A flâneur thus played a double role in city life and in theory, that is, while remaining a detached observer. “The deepest problems of modern life derive from the claim of the individual to preserve the autonomy and individuality of his existence in the face of overwhelming social forces, of historical heritage, of external culture, and of the technique of life. “— Georg Simmel, "The Metropolis and Mental Life". Walter Benjamin adopted the concept of the urban observer both as an analytical tool and as a lifestyle. Debord defines the dérive as "a mode of experimental behavior linked to the conditions of urban society: a technique of rapid passage through varied ambiances."It is an unplanned journey through a landscape, usually urban, in which participants drop their everyday relation and 'let themselves be drawn by the attractions of the terrain and the encounters they find there'. Debord indicates.
Events/ Exhbitions.
SPECTRA festival In Aberdeen organized by Curated Place. 30,000 people saw it over the four days.
Maxxi. Rome Italy Media Arts. Festival
Warehouse 9. Copenhagen. Denmark
![]()
ENTER MASTER ONLINE VISUALISATION ARTWORK Derive http://138.68.135.245:3000/public3/index.html
DOWNLOAD APP "1001001". For V1 Android only. http://138.68.135.245:3000/
INSTRUCTIONS. V1: Type in this URL and download. Then open the APP. It asks you to register (name and email ). Then choose city ie Aberdeen, Then press Track. Then press the lock icon and put it in your pocket. Then leave for a few hours and go for the walk.
NOTES:ENTER STANZA API version one see here.
KEYBOARD. 1 2 3 (0.3 km radius 1.8km and 5.km )
http://138.68.135.245:3000/city-info/58892ed46209e776b5947a42
http://138.68.135.245:3000/device-info/58892ed46209e776b5947a42/588e0440a1959c662d224a69
Copenhagen = C
58892ed46209e776b5947a42 = Aberdeen = A
58892ed46209e776b5947a43 = Rome = R
58892ed46209e776b5947a44 = Stavanger = S
58892ed46209e776b5947a45 = London = L
2d = 2
3d = 3
Random walk. = X
Screen shots Showing GPS tests.
 |
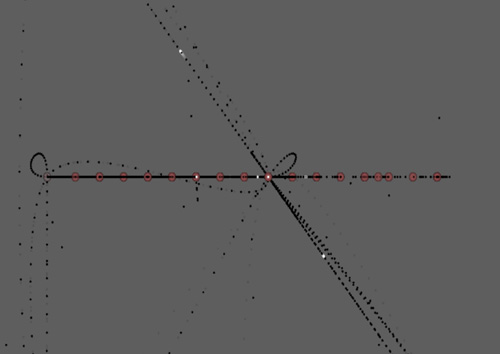 |
| Track at 800 m radius. IE down the street | Track at 20 m radius. IE in the house. |
DOWNLOAD "1001001". For V1 Android only. http://138.68.135.245:3000/
Credits. Stanza artwork (C) 2017. This newly commissioned artwork is part of The Enlight Programme of artistic events and residencies. This project is facilitated by Curated Place. Technical support Nick Rothwell and Jonathan Jones-Morris.
Volunteers Needed Logistics Needed for presentation events. (Minimum 10 people up to 1001 people)
- 10 people wearing black trousers and shoes needed. I suggest some extra people are gathered in case of no show.
- 10 black hoodies to be provided . (large size)
- The need to be made in advance. Use the Krungthep font see below.
Technical.
- A HD (1920 by 1080) projector to show the result somewhere.
- The software visualisation work will be browser based.
- The machine should be connection via ethernet not wireless.
- Spec apple mac 16 gb and extra graphics card (not just on board ) running Chrome browser (The new laptops)